For fashion teams outgrowing range analytics · compared with Style Arcade
Style Arcade shows the plan. merchmix runs it.
From budget and range through allocation, POs and markdown, on one live view of your sales, stock and competitor signals, every recommendation becomes an action the same day, without re-typing it into another system.
- 10+ systems, 50+ spreadsheets
- What a mid-market retailer runs on before merchmix.
- Live in seconds
- Sales, stock and trade, near real time.
- Free 6-week POC
- On your own data, no contract.
Every tool reads. merchmix acts.
- From read to PO, in one moveMost tools stop at the recommendation, and someone re-keys it into a PO system by hand. In merchmix the reorder call becomes a draft PO in your ERP the same day, approved by your team, written straight back to the system of record.
- One live number, every teamRange, allocation and markdown usually sit in separate tools, each landing on a slightly different figure. merchmix runs them on one live view of your sales and stock, so finance, planning and trade all work from the same number and the meeting starts at the decision.
- Budget connected to the buyA reorder call means nothing if it breaks the budget. merchmix builds OTB top-down, business to subcategory, and carries it live through range, allocation and trade, so every buy is checked against the plan before it is placed, not after.
merchmix and Style Arcade
merchmix plans the buy, then runs the season.
The read has never been the problem. Tools like Style Arcade see the data well. What is missing is the system that connects that read to the action, budget to shop floor, in one place. Style Arcade plans and analyses the buy beautifully. merchmix does that too, then allocates it, executes it, and runs the season around it.
merchmix
Merchandising-led, planning and trading · Action layer, yukti, allocation and the planogram
- Reads daily stock and sales, then turns that read into the day's actions: the risk flagged, the PO drafted, the allocation moved
- Tracks competitor pricing and new-product activity, and ingests live demand signals
- yukti detects risk, quantifies the financial impact and recommends the action
- Every recommendation becomes a tracked task, assigned to an owner with a due date
- A reorder or markdown call becomes a draft PO or an allocation in your ERP the same day, no re-typing
- OTB and budget built top-down and carried live through range, allocation and trade
- Allocation and replenishment by store and size, on the same live demand data
- Visual merchandising, floor plans and fixture ROI connected to the same stock and range
- Scenario and what-if modelling across sales, margin and stock
- Landed cost, cross costing and margin checked before the buy is committed
- Weekly trade review replaces the emailed recap deck; critical path links range to launch dates
- One live number for every team, across apparel, FMCG and furniture, not fashion alone
Style Arcade
Fashion-focused, range analytics · Insight layer, range boards
- Pulls live sales and stock from your ERP, POS and ecommerce systems
- Beautiful, purpose-built range visualisation and range boards for fashion
- Calculates precise buy and reorder quantities by size and store
- Size curves, landed cost and scenario planning built into the buy file
- Checks the buy against OTB and budget as you plan
- Fast to adopt, merchandiser-friendly, live in weeks
- Exports cleanly into your PO and planning systems
core
From first signal to shop floor.
Beyond reading your data, merchmix runs the whole season. core runs budgets, planning, range building and daily trade in one place, reading years of your sales history alongside live signals from every connected system. Where a range tool shows you the read, core turns it into the buy, the allocation and the trade, live, connected, and writing back to your ERP, OMS or Shopify.
Direction
The season usually starts with last year's file, copied forward and adjusted by hand. merchmix starts it by reading years of sales history alongside live market signals, showing where growth can come from and what is holding it back. You open the season pointed at opportunity, not at a template.
core · DirectionSnapshot 2 July 2026Outcome influence mapWatchOpen detail →Driver mix from the latest briefing flagsSelect a driverOverstock exposure · 64.7%AW25 outerwear · 22.4 weeks cover — $21.2M of the $32.8M at risk across 6,720 SKUs. Mark down, then transfer the residual.Revenue$21.2MSKUs6,720yukti · AW25 outerwear is holding 22.4 weeks of cover at 8% margin, so the markdown clears it before the autumn intake lands.Revenue at risk$32.8MAcross all four driversTop actionmarkdown2,376 SKUsBudget
No more targets pasted into a tab and reconciled by email. Growth direction becomes commercial targets: sales, GP, stock investment and OTB, down to category level. One budget, one version, agreed once and carried through every stage that follows.
Edit budget · 2027Outerwear · top-down and bottom-up allocations, by store and week.Hierarchy viewStore → Metric → Deptyukti · Northgate is running 6.1% ahead on Outerwear with cover at 6.2 weeks, so W2 carries $46,200 without moving the intake.Hierarchy Total company (sales $) $1,248,750 $1,312,500 $1,385,625 $1,451,250 Total company (sales u) 20,813 21,875 23,094 24,188 Total company (GP $) $799,200 $853,125 $886,800 $943,313 Total company (GP %) 64.0% 65.0% 64.0% 65.0% 300 · Northgate (Outerwear) – – – – Sales $ (metric) $39,960 $42,000 $44,340 $46,440 Sales U (metric) 666 700 739 774 GP % (metric) 64.0% 65.0% 64.0% 65.0% GP $ (metric) $25,574 $27,300 $28,378 $30,186 Control
This is the WSSI you already run, without the exports. The budget becomes a weekly sales, stock and intake plan that updates itself, continuity protects your never-out lines before gaps become lost sales, and every change stays connected to the numbers you signed off.
Merchandise financial planningWomenswear · Outerwear — sales, stock, intake and markdown in one live weekly view.?BrandAllCategoryWomenswearSub-categoryOuterwearStoreAll storesYear2026ViewSearch metrics…Quick POMetric Trend Q1 1 2 WK1 WK2 WK3 WK4 WK5 WK6 WK7 WK8 TY WoW % 6.8 -8.4 -4.6 2.8 3.5 -1.9 4.2 2.6 FC WoW % 4.3 -3.1 -1.8 1.5 2.2 1.4 2.0 1.7 BGT WoW % 2.8 4.7 1.9 2.3 3.1 1.2 2.4 2.0 Gross sales TY 1,256,173 1,150,655 1,097,725 1,128,461 1,167,957 1,145,766 1,193,888 1,224,929 Full-price sales TY 1,174,686 1,070,110 1,019,605 1,048,821 1,085,997 1,063,356 1,110,708 1,140,909 Markdown sales TY 81,487 80,545 78,120 79,640 81,960 82,410 83,180 84,020 Gross sales FC 1,210,000 1,172,000 1,151,000 1,168,000 1,194,000 1,211,000 1,235,000 1,256,000 Discount % FC 24.0 24.5 24.8 24.6 24.2 24.0 23.8 23.6 Gross sales BGT 1,160,000 1,215,000 1,238,000 1,266,000 1,305,000 1,321,000 1,353,000 1,380,000 MFP recommendationsAI-driven analysis across sales, intake, stock, margin and weekly cover.Stock opportunity$45,200Potential upside from forecast adjustmentStock risk$128kProjected overstock exposureSKU candidates48Metrics flagged for reviewPriority actionsRebalance: Women’s outerwear12 SKUs are projected to exceed 20 weeks cover by W9, while forecast sales are recovering from W4 onward. Review markdown timing, intake phasing and transfer opportunities before committing further buys.High confidenceAvg cover 22.4wRange
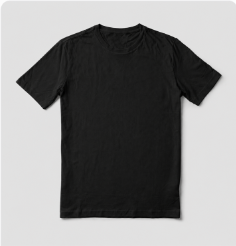
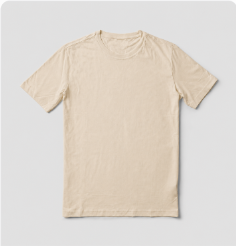
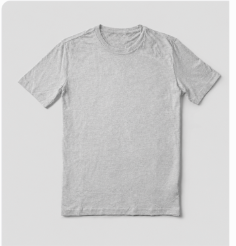
Range boards replace the static deck, size curve and visual range analysis sit natively in the workflow, not in a separate tool that stops at the read. Cross costing replaces the margin tab. Option counts shape the assortment, and supplier, landed cost and margin are checked before you commit the buy, so the range insight and the budget are never disagreeing again.
Dashboard›Assortment Plan›Range Boards›2026-H2-Men-Home-WearRange Board Details
Review and adjust plans by group. Direct ERP synchronization ready.
Vintage Oversized Cotton Tee PackSKUS: 13UNITS: 3,250LANDED: $27,625ORDER: $94,250Draft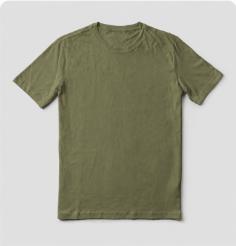
Moments
Trading moments and marketing spend are planned against the same numbers as the range, not in a separate calendar file. The calendar and the buy never disagree, and every promotion and drop lands against stock that is actually there.
FY27Womenswear · Outerwear — build the channel allocation, review, approve, then track against it.DraftChannel planReviewApprovalTrackingTotal spend$6,392.37Incremental rev$38,993.46ROAS6.1xOrders268WeekMonthQuarterChannel W1 W2 W3 W4 W5 W6 Baseline (organic)baseline — — — — — — Trading & promo Performance $672.16 $672.16 $672.16 $1,458.63 $1,458.63 $1,458.63 Paid social $262.16 $262.16 $262.16 $1,048.63 $1,048.63 $1,048.63 Paid search $410.00 $410.00 $410.00 $410.00 $410.00 $410.00 Weekly spend $672.16 $672.16 $672.16 $1,458.63 $1,458.63 $1,458.63 Budget line $3,329.29 $3,677.63 $4,388.34 $4,208.94 $3,781.38 $3,943.32 Variance $2,657.13 $3,005.47 $3,716.18 $2,750.31 $2,322.75 $2,484.69 Trade and review
The Monday meeting, without the version debate. merchmix surfaces the ranked move, your team approves, one click executes it across your stack, and the decision log records every call. Product reviews feed what worked back into the next budget, and the cycle starts again.
AllSeasonal wrapPerformanceWeekly trade dashboardTopline metrics, category drill-down and the actions the room agrees on.Sales$793.6K+6.1% vs LYGross profit$367.7K+7.0% vs LYGP %46.3%+0.4 pts vs LYMarkdown18%-1.6 pts vs LWTop best sellersHero SKUs ranked by sales.Hero Leather SandalSS26-1042Sandals / SlidesUnits248Sales$31.8KMargin61.4%WOC6.2Luna Strappy HeelSS26-1067Heels / OccasionUnits211Sales$27.6KMargin58.9%WOC7.1Bottom sellersLowest-productivity SKUs.Cloud Walker SandalsAW25-0871Sandals / SlidesUnits38Sales$2.4KMargin8.0%WOC66.4Sky Strider Flip-FlopsAW25-0904Sandals / SlidesUnits49Sales$3.1KMargin9.7%WOC61.7Report PDFExecutive summaryOne clear narrative for the meeting.Trade commentarywaitingSalesCurrent$793,560STD$4,862,400Next week$812,000Gross profitCurrent$367,694STD$2,245,900Next week$376,000
One platform, built to grow with you.
merchmix helps your team plan what to buy, put stock where demand is, and keep the shop floor selling. Every product stands alone: buy one, buy a few, or run the whole platform. Most retailers start with core, because that is where it hurts.
- coremost start here
Plan the season in one place.
Budgets, WSSI, OTB, ranges and sizes, connected. Replaces the planning spreadsheets.
- core plus
core, plus allocation and the planogram.
Allocation and replenishment by SKU, store and week, and the shop floor made to match the plan.
- forge
Every product, from first sketch to costed, approved and ready to sell.
Specs, samples, suppliers and critical path, linked to buying and planning.
- beacon
One portal for your suppliers.
Orders, shipments, invoices, on time.
- atlas
Every number you trade on, live, on one screen.
Dashboards, reporting packs and the Monday meeting, without the deck.
- horizon
The retail ERP that already knows what a season is.
Products, inventory, purchasing, sales and finance, connected to the plan.
- orbit
Receive, store, pick, ship.
Warehouse management that talks to the plan.
- vertex
Every order, every channel, one view from click to doorstep.
Routing, splits, backorders and fulfilment exceptions across every location.
- yukti
The agent that does the work.
Rebalances, replenishes, raises the PO, creates the style. You approve, or let it run.
Every product stands alone. Start with the one that hurts most.
Style Arcade can stay for now.
merchmix connects to the systems you already use, giving teams one live view of sales, stock, orders, suppliers and store performance. Nothing gets ripped out: your ERP, POS and ecommerce tools keep doing their jobs, and the exports your team used to run by hand become feeds that run themselves.
Some teams run Style Arcade and merchmix side by side today. merchmix is built to make that need smaller over time, not to force a rip-and-replace on day one.
merchmix was built by people who have worked inside brands like ASOS, M&S, Best & Less and SABA, buying, planning and trading real ranges, with real stock, real suppliers and real margin pressure. That experience is built into the platform: fewer disconnected decisions, faster action on stock risk and clearer commercial control for finance.
Start with the workflow that hurts most, then add more as the business grows.
Questions, answered.
Is merchmix a Style Arcade alternative or a replacement?
Both, depending on the team. merchmix covers the same range and size curve analysis Style Arcade is known for, then connects that read to budget, OTB, supplier POs, allocation, replenishment and markdown. Teams that only need the range read can keep using Style Arcade. Teams that want that insight to run the season move it into merchmix.
Can I keep Style Arcade and still use merchmix?
Yes. Some teams run both today. merchmix is built to reduce how much you need a separate analytics layer over time, not to force you off a tool that's working for you.
Does merchmix do size curve analysis?
Yes. Size curve analysis runs natively in merchmix's range and allocation workflow, connected to live sales and stock, not as a standalone report.
Does merchmix do markdown suggestions?
Markdown sits inside merchmix's live trading reviews, where stock, sell-through and cover are visible alongside the rest of the season. It's part of the weekly decision, not a separate optimisation engine.
What is the difference between WSSI and MFP?
They describe the same discipline. WSSI, weekly sales stock and intake, is the UK and European term; MFP, merchandise financial planning, is the US one. merchmix runs both as one live planning grid.
How does data get in without manual exports?
Through connectors across ERP, POS, ecommerce and supplier systems. Sales, stock and intake feed in automatically, and your ERP stays the system of record.
Does merchmix only work for fashion?
No. merchmix spans apparel, FMCG and furniture, in the same platform, on the same connected planning and trading workflow.
What does it take to move from a range tool to merchmix?
Less than replacing a system, because there is nothing to rip out. merchmix connects to the stack you already run, and most teams start with the workflow that hurts most, then add products as the business grows.
Is merchmix hard to learn if my team is used to a range tool?
No. The planning and range views are editable grids your team will recognise. What changes is what sits behind them: live data, budget connection, and a route from every decision to execution.
It runs the season, not just the read.
A 1-hour demo with sales and product, then a free 6-week POC on your own data, no contract. Live in 12 to 15 weeks, end to end.