Retail planning, explained
What is a WSSI and how do you build one?
A WSSI (MFP), short for Weekly Sales, Stock and Intake, is a weekly grid that plans and tracks how much a retailer expects to sell, how much stock it will hold, and how much new stock it will take in, week by week across a season. It is the control mechanism that connects a financial budget to what actually gets bought, allocated and traded.
This guide covers what each row means, a worked six week example, how the WSSI drives open-to-buy, and how retail teams run it every week.
9 min read · Updated 15 July 2026
In this guide
The basics
WSSI stands for three weekly numbers.
WSSI stands for Weekly Sales, Stock and Intake.
Those three words are the whole idea. Every week of a season has a number for what you sell, a number for what you are holding, and a number for what is arriving. The WSSI is where those three numbers are planned together, compared against last year and against budget, and re-forecast as the season actually trades.
The weekly part is not a convention, it is the point. A monthly view is too coarse to catch a trend while you can still act on it: by the time the month closes, the intake is landed and the decision is gone. Daily is mostly noise. A week is long enough to be a signal and short enough to still change the buy, which is why it is the tempo the whole trading calendar runs on.
It is planned at retail value rather than units because that is the language the budget and the open-to-buy already speak. One currency runs from the finance target all the way down to what the buyer commits. And it is built by hierarchy, department to category to subcategory, so a planner can look at the entire business or at one shelf of it without changing grid.
Terminology
WSSI and MFP are the same job.
Effectively, yes. Both describe the same job: planning sales, stock, intake and open-to-buy at weekly level. WSSI is the common term in UK and Australian retail. MFP (Merchandise Financial Planning) is more common in the US. If someone hands you an MFP and someone else hands you a WSSI, you are looking at the same work under two names.
The distinction people sometimes draw is that MFP names the discipline and WSSI names the thing it produces, the weekly grid itself. Almost nobody is that careful in practice, and both terms get used for both. It is not worth correcting anyone over.
Where it does matter is in a business running both. The vocabulary is not the risk, the construction is. Before you compare a US plan to a UK one, check they are on the same trading calendar and that stock is stated the same way in both, at cost or at retail. Two grids with the same name can still be answering different questions.
The rows
Nine rows do the real work.
Every WSSI is a table of weeks across the top and rows down the side. The rows vary between retailers, but these are the ones that do the real work.
| Row | What it is | Why it matters |
|---|---|---|
| Opening stock | The stock you hold at the start of the week, at retail value | The starting position. Every other number moves from here |
| Sales, full price | What you expect to sell, or did sell, at full price | The healthy half of your sales. Protects margin |
| Sales, markdown | What sells at a reduced price | Shows how much of your turnover you are buying with margin |
| Intake | New stock arriving that week, also called receipts | The lever you can still pull. Sales are a forecast, intake is a decision |
| Closing stock | What you are left holding at the end of the week | Becomes next week's opening stock. This is the chain that makes a WSSI a WSSI |
| Weeks cover | Closing stock divided by average forward weekly sales | The early warning. Tells you whether you run out or drown |
| Markdown % | Markdown sales as a share of total sales | The margin health check |
| Sell-through % | Sales as a share of the stock available to sell | Tells you whether the buy was the right size |
| OTB (the output) | Open-to-buy: how much you can still commit to | Not a row you plan, a number the other rows produce. It is what the buyer actually spends, and it is covered in full further down. |
Closing stock = Opening stock + Intake, minus sales, minus markdown taken.
That is the whole engine. Each week's closing stock becomes the next week's opening stock, so a change in week two ripples through to week twenty. It is also why a WSSI kept in a spreadsheet gets dangerous: one broken formula in one week quietly rewrites the rest of the season.
See it in numbers
Six weeks, one category, in numbers.
Numbers make this obvious in a way definitions never do. Here is one category, planned across six weeks, at retail value in thousands of dollars. Sales are shown as one line here to keep it readable, though a real WSSI splits full price from markdown. Then here is what happens when it trades ahead of plan.
First, the plan.
| Week | Opening stock | Intake | Sales | Closing stock |
|---|---|---|---|---|
| 1 | 500 | 120 | 95 | 525 |
| 2 | 525 | 80 | 105 | 500 |
| 3 | 500 | 60 | 110 | 450 |
| 4 | 450 | 100 | 120 | 430 |
| 5 | 430 | 40 | 115 | 355 |
| 6 | 355 | 60 | 125 | 290 |
Read one row and you have read them all. Week 1 opens at 500, takes in 120, sells 95, and closes at 525. That 525 opens week 2. The plan walks stock down from 500 to 290 across six weeks while selling 670 in total, which is exactly the intention: end the phase clean, without a mountain of stock heading into markdown.
Now what happens when it trades ahead. The category sells about 12% ahead of plan for three weeks. Good news, and the WSSI is where you find out what it costs you.
- 3.8 weeks
- Cover, as planned
- 3.1 weeks
- Cover, actual
| Week | Opening stock | Intake | Sales (actual) | Closing stock | vs plan |
|---|---|---|---|---|---|
| 1 | 500 | 120 | 108 | 512 | 13 behind |
| 2 | 512 | 80 | 118 | 474 | 26 behind |
| 3 | 474 | 60 | 124 | 410 | 40 behind |
Sales are up. Everyone is happy. But look at the closing stock: 410 instead of 450, and intake for the rest of the phase was already committed at the planned level.
Now check cover. At the end of week 3 the plan expected 450 of stock against roughly 120 of average forward weekly sales, which is 3.8 weeks of cover. What you actually have is 410 against forward sales now running nearer 134 a week, which is 3.1 weeks of cover. The category is selling better and heading for empty shelves at the same time.
That gap is the entire value of a WSSI. It does not tell you the good news, your sales report already did that. It tells you the consequence of the good news, early enough to do something about it: chase more intake, pull stock forward, or accept the sell-out and protect the margin.
The output
Open-to-buy falls out of the WSSI.
Open-to-buy is the answer the WSSI exists to produce. It is how much more stock you are allowed to commit to, and it falls out of the plan rather than being decided separately.
The calculation, at retail value, for any given period:
OTB = planned closing stock + planned sales + planned markdowns, minus opening stock, minus intake already on order.
In plain terms: work out where you need to end up, add what you expect to sell on the way, then subtract what you already have and what is already coming. Whatever is left is what you can still buy.
Put the category from earlier through it. At the end of week 3 you are holding 410. You still want to close week 6 at 290, you now expect to sell 403 across the last three weeks rather than 360, and 200 of intake is already on order. That is 290 plus 403, minus 410, minus 200, which leaves 83 of open-to-buy.
On the original plan that number was zero: 290 plus 360, minus 450, minus 200. The buy was fully committed. Selling ahead is what opened the 83, because finishing in the same place while selling more means more stock has to come in. That is the chase the falling cover was asking for, and the WSSI is what sized it.
This is why the WSSI and the buy cannot live in different places. If the WSSI moves and the OTB does not move with it, the buyer is spending against a number that stopped being true weeks ago.
How it runs
A WSSI is a weekly meeting.
A WSSI is not a document, it is a weekly meeting with a grid attached. The rhythm is roughly the same everywhere, and so is the part that never makes it into the process doc: how much of the meeting goes on agreeing the numbers before anyone gets to talk about the decisions.
- Get the actuals.
- Last week's sales and stock come in from the POS and the ERP. In plenty of businesses they do not arrive so much as get fetched, and the plan cannot meet reality until they do.
- Review the variance.
- Where did we beat the plan, where did we miss, and does the miss look like a blip or a trend. This is the step that stalls when two people arrive with two versions of the same number.
- Re-forecast the weeks ahead.
- The planner edits the forward sales line based on what just happened. This is judgement, not arithmetic. A trend line can tell you sales are climbing. It cannot tell you the climb is a promo you already know ends Friday. This is the part that takes experience.
- Recheck cover and OTB.
- The re-forecast changes closing stock, which changes cover, which changes what you can still buy. Skip it and you have re-forecast for nothing.
- Commit and act.
- The new version is saved as the baseline, and the decisions that fall out of it go to the people who execute them: chase this, allocate that, hold this, mark that down.
Then it happens again next week. A WSSI that gets built once a season and never touched again is not a WSSI, it is a budget with weeks drawn on it.
Where it breaks
Spreadsheets stop working at scale.
Almost every retailer starts here, and for a while it is completely fine. It stops being fine for reasons that have nothing to do with how good the planner is.
- Actuals arrive by hand.
- Someone exports sales, exports stock, pastes both in, and reconciles the difference. By the time the grid is right, a day of the trading week is gone.
- There is no single version.
- WSSI_v4_FINAL_amended.xlsx is on someone's desktop, and a different one is attached to Monday's email. Nobody can say which one the buy was signed off against.
- The chain breaks silently.
- Every week's closing stock is the next week's opening stock. Overwrite one formula in week 9 and every week after it is quietly wrong, with nothing to flag it. You do not find out from the grid. You find out when the intake lands and the numbers were never real.
- It does not reach the decision.
- The spreadsheet can tell you cover is falling. It cannot raise the chase order, move the allocation, or check the OTB before someone commits. The insight and the action live in different buildings.
This is the gap the industry keeps measuring. IHL Group found that AI and machine learning are already producing results in demand planning and forecasting for 76% of retailers, while fewer than one in four have rolled it out in the areas where inventory distortion actually happens. Forecasting was never the hard part.
In merchmix
In merchmix, the WSSI starts from the budget.
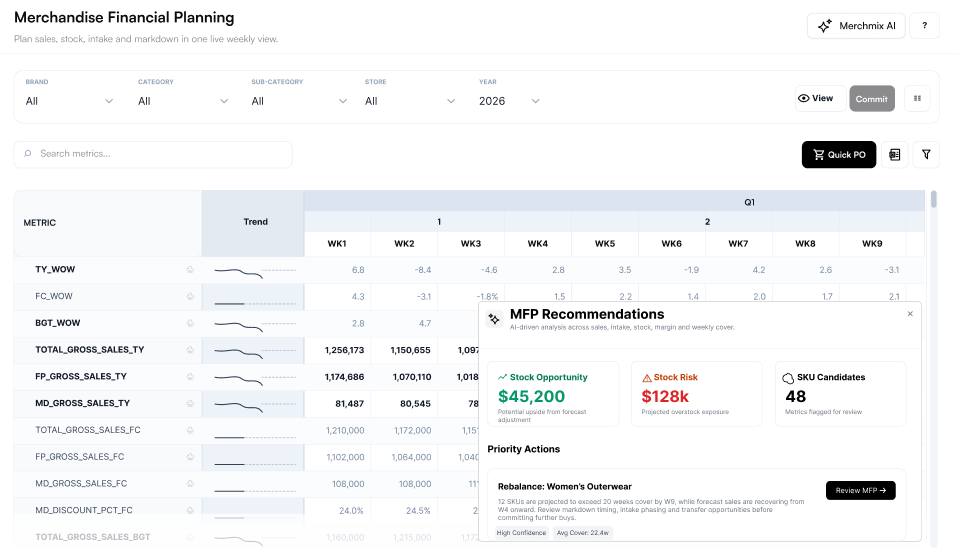
In merchmix the WSSI does not start from a blank grid. The budget arrives from the budget builder in core, business targets already broken down to department level, so the weekly plan is anchored to the number finance signed off rather than a number someone retyped. Option plans set the constraints on the forecast. Sales and stock come in live from your connected POS and ERP, alongside pricing and promotion data, your trading calendar and your product hierarchy.
Planners edit the forecast directly in the grid, with version control, so a plan can be saved, compared against an earlier one, and restored when the call turns out to be wrong. It carries this year against last year and the year before, splits full price from markdown, tracks discount depth, and moves from department to category to subcategory without changing grid. Once a version is committed it becomes the baseline: the system of record for the weekly trading plan.
The grid also does some of the looking for you. yukti, the agent, reads the same weekly numbers and surfaces what is worth a second look: where cover is drifting, where stock is at risk, and where there is upside worth chasing, with the reasoning shown alongside it. The planner keeps the pen.
That is where it stops being a grid. The committed WSSI produces the weekly sales forecast, the stock flow plan, the markdown plan and the variance against last year, and those become the inputs the rest of the platform runs on. Allocation and replenishment in core plus take their chase and distribution logic from it. Continuity reads it to protect the never-out lines. Markdown decisions are made against it and write back to it when a price changes. It feeds the budget builder for financial alignment, and atlas, trade reviews and finance forecasts all read the same committed numbers.
So when a planner re-forecasts on a Monday, the open-to-buy moves with it, the chase recommendation updates, allocation reads the new position, and the executive view is already telling the same story. Your team still makes every call. The platform makes sure the call reaches the places it needs to reach, while it still counts.
See if this fits the way you already work.
Questions, answered.
What is a WSSI?
A WSSI is a weekly planning grid used by retailers to control stock. It sets out, for every week of a season, what you expect to sell, what stock you will be holding, and what stock is arriving. Those three lines are planned together and re-forecast as the season trades, and they produce the open-to-buy: the number that decides how much more stock you can commit to.
What does WSSI stand for?
Weekly Sales, Stock and Intake.
What is the difference between WSSI and MFP?
They describe the same discipline: planning sales, stock, intake and open-to-buy at weekly level. WSSI is the common term in UK and Australian retail, MFP (Merchandise Financial Planning) is more common in the US.
What is the difference between a WSSI and an OTB?
The WSSI is the plan, the OTB is one of its outputs. Open-to-buy is calculated from the WSSI: planned closing stock plus planned sales and markdowns, minus opening stock and intake already on order. Change the WSSI and the OTB changes with it.
Can you run a WSSI in Excel?
Yes, and most retailers start there. It breaks down at scale for three reasons: actuals have to be pasted in by hand, there is no single agreed version, and a formula overwritten in one week silently corrupts every week after it. It also cannot act on what it shows you.
Who owns the WSSI?
Usually the merchandiser or planner, but it is read and used by buyers, inventory planners, heads of trading and finance. It works best when all of them are looking at one committed version rather than separate copies.
How often should a WSSI be updated?
Weekly. Actuals land, the forward forecast is revised, cover and OTB are rechecked, and the new version is committed. A WSSI built once and left alone is a budget, not a control mechanism.
What are the main rows in a WSSI?
Opening stock, sales split by full price and markdown, intake, closing stock, weeks cover, markdown percentage, sell-through and open-to-buy. Closing stock carries into the following week's opening stock, which is what links the weeks together.
How do you calculate weeks cover?
Closing stock divided by average forward weekly sales. It answers how many weeks the stock you are holding would last at the rate you expect to sell. Falling cover on a category that is trading well is the classic early warning of a sell-out.
What is a good weeks cover?
There is no universal number, and anyone who gives you one is guessing. The right cover is the cover that matches your ability to react. A continuity line you can replenish weekly might run comfortably on four weeks. A seasonal buy with a twelve week lead time sitting on four weeks of cover is already in trouble, because by the time you notice, there is nothing you can do about it. Cover should be read against your lead time and your reorder options, not against a benchmark.
Signals matter while there is time to act.
Let us show you how merchmix keeps teams trading instead of firefighting.